Velocity – Understanding Your Points
 I started this project to help me find the right data points to assist not only with better iteration planning but also to help me plan future iterations with a solid estimate of what we typically complete. I started off by looking at our Velocity, typically the number you use but not something we find as a good predictor of success. To figure out why, I separated out, by iteration, our planned points, our actual points and the average of the actuals.
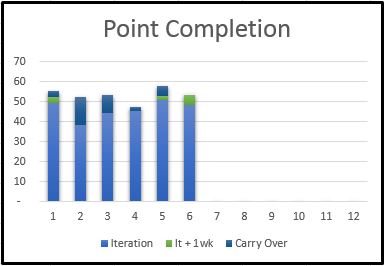
As you can see by the chart to the left, that gave a pretty clear picture of what we’ve done so far this year; we average 46 actual points per iteration but average 53 planned points. That’s basically a weeks’ worth of work that we’re off by. In doing this, I was curious to see how many points are actually being completed in the week after the iteration vs what we ended up carrying over to the next iteration either as a full or partial story.
What I found was that we very rarely complete during that week, in the six months that I am looking at only 10 points were done in total for an average of 2 BUT when you look at carry over you can see that we average 6 points per iteration – just a point shy of the variance between our average velocity numbers.
 What that says to me is that we’re not just having a task planning issue but that the scale with which we assign our points needs to be revisited. Very early on we decided that a 13 equaled a solid will-get-it-done in the iteration number and that a 20 was the upper might-get-it-done number. Now it looks like we shouldn’t be planning for any story that scores a 13 or above in a single iteration, that 13 needs to move into the upper might-get-it-done slot with a 10 being the better will-get-it-done in the iteration number. I think this also means we need to split our stories down into smaller pieces.
Our current iteration is planned with a total of 47 points, which is just above the actuals average, a very good test for this theory.
Next up I need to take these charts and work on projections.

What tool are you using to track Velocity? Thanks.
We use Excel primarily with a few SharePoint lists for tracking unplanned tasks and backlogs.
Reblogged this on MTE Advisors.