Velocity – Reporting vs Predicting Progress
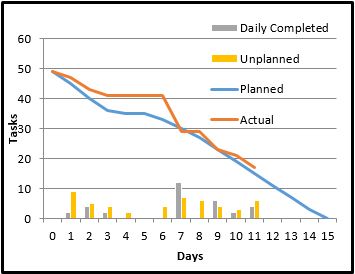 This is my team’s burndown chart, what we use to communicate progress across all groups and how we measure progress against the plan. You may notice that there are a few data points that aren’t typical in most Agile burndowns; the first being that we don’t measure progress in story points and the second that we also track unplanned tasks. I’ll explain each in turn.
We implement our reporting based on tasks completed because, up until recently, most of our stories represent a single project that can be completed in a single iteration. This has changed as our projects have more recently become longer term (3-6 iterations) mostly due to us moving from enhancing products to implementing new ones.
My team is solely responsible for all support work for all of our products, I agree it shouldn’t be that way but it is. We keep track of unplanned tasks as a way of tracking where product support issues impede the progress on new projects. It also has the benefit of showing that we have work above and beyond the current projects slated, something that upper management should be reminded of.
So here I sit, comfortable with this one report because it accurately reflects two metrics – our task plan vs our actual and unplanned tasks vs planned task – and it at times shows how one of those impact the other. But it is very much a snapshot of a single bucket of work, most times from beginning to end, and doesn’t help much with predicting future capabilities or future issues. Both of which we consider in planning but it is gut feeling without any data backup.
Given that, I know that I need something that shows our velocity along with an average across the iterations I’m t racking. But I really also need to take into consideration the gap we have between planned and actuals.
 I’ve started with this chart, showing the number of points we scored each iteration and using the velocity line to represent the points delivered within the iteration and the average of that velocity number over the iterations so far. Which works pretty well I think. This gets us a little bit further towards understanding what the team is able to deliver. While we plan, on average, in the 55 point range per iteration we actually deliver, on average in the 45 point range.
But what it doesn’t show is how many of those points are delivered within a day or two of the end of the iteration (most common scenario is we’re a few days behind on one story) vs where we ended up extended the story into another iteration. The latter is a bigger concern of mine and one that we don’t currently track. Which means my initial iteration burn down doesn’t have all the data I need in it and that I need to go back and re work our burndown data points. More to come.

What tool is this you are using to track velocity and burndown chart?
I’m just using Excel for the charts